Your browser is not supported, please use a recommended browser here.
8-9-2018
While the effects of China’s trade war with the U.S. have primarily focused on steel, aluminum, pork, wheat and (most specifically) soybeans, consumer-oriented goods have largely remained untouched. As previously reported in June (see https://www.worldperspectives.com/articles/china-i..., the Chinese government decided to reduce most favored nation (MFN) tariffs on a range of food and beverage categories from 15.2 percent to 6.9 percent as of 1 July. It was noted at the time that the goal was to lower food inflation for China’s growing middle class and provide its consumers with broad access to quality products.
While China reversed course later in June on imports of U.S. soybeans, sorghum, wheat and pork in response to the Trump administration’s enacting tariffs on $50 billion worth of China’s exports to the U.S., consumer-oriented goods have continued to flow as normal. The June export figures for U.S. agricultural products sold to China show a dramatic decrease in the ratio of bulk commodities to higher-value goods. The lone exceptions at this point are hides, skins and hay, which have not been targeted with retaliatory tariffs. On the high-value side, cherries, wine, pistachios, almonds and beer continue to do reasonably well, particularly when factoring China’s currency devaluation.
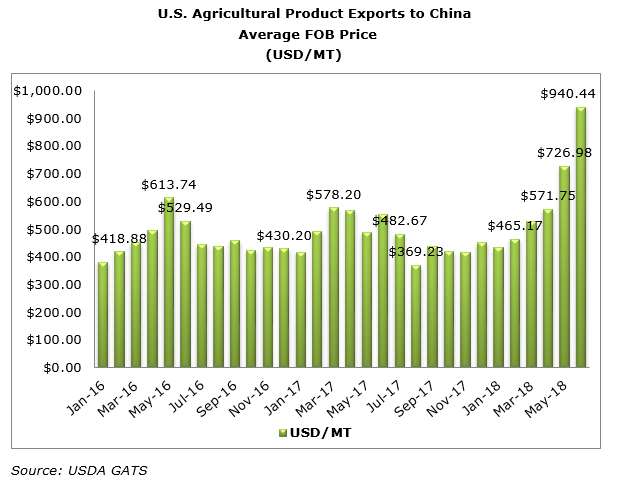
Just 558,356.10 MT of U.S. agricultural products left U.S. ports in June for the Middle Kingdom, down substantially from 1.194 MMT in June 2017 and the lowest volume for that month in seven years. With a total value of $525.1 million, the average FOB price was $940.44/MT, up $384.90/MT (69.3 percent) from June 2017 and one of the highest monthly averages in the past five years. It also marked the fifth consecutive month that the average FOB price for U.S. agricultural products to China increased.
Looking at the aggregate results for the first half of 2018, the total quantity of U.S. agricultural exports was at its lowest level for that period since 2013. At 12.96 MMT, they were down 2.93 MMT (18.4 percent) versus January-June 2017. The impact of higher-value goods, however, is evident in the data. The total value of $6.74 billion translated into an FOB price of $520.21/MT, up $32.90/MT (6.75 percent) from the first half of 2017.
